![]()
HTTP/S Load
- Overview of HTTP/S Load
- Core Functions of HTTP/S Load
- Using HTTP/S Load
- The Commander Interface
- Commander Toolbars and Function Bars
- The Commander Main Window
- The Repository Window
Overview of HTTP/S Load
HTTP/S Load supplies flexible software that enables you to quickly develop and run HTTP/S load Tests and production monitoring Tests, to help you assess the performance of Web Application Environments (WAEs).
HTTP/S Load is comprised of several Modules including the OpenSTA Architecture and the Commander GUI which runs within it. Use Commander to initiate and control the Test development process, including Script creation, Collector creation, Test creation, running Tests, monitoring Test-runs and displaying the results data for analysis.
HTTP/S Load combines HTTP/S recording and Script modeling functionality, using the Script Modeler Module, with Test creation and system data collection. It records browser requests issued during a Web session at the HTTP/S level, rather than recording the real time events of a browser, in order to create Scripts. This allows you to create and run load Tests, incorporating Scripts, that use minimum system resources enabling you to carry out large volume load Tests.
In Commander, a Test is represented as a table known as the Test Pane. This is the workspace where you can develop the contents of a Test by adding the Scripts and the Collectors you need from the Repository. Select them individually working from the Repository Window, then drag and drop them into the Test Pane in the required order.
Collectors are used to monitor and record performance data during a Test-run. They contain user-defined data collection queries and monitoring options that control the data collected from Host computers and other target devices during a Test-run.
Scripts are created from the recordings of HTTP/S browser requests issued during a Web session and written in SCL scripting language, which enables you to model their content. They encapsulate the Web activity you want to simulate during a Test-run and enable you to generate the load levels required against target WAEs by controlling the number of Virtual Users who run them.
Tests can be comprised of one or more Collectors, one or more Scripts or a combination of both, depending on whether you are performance testing a system within a development or a production environment. It is possible to modify a load Test to monitor the same target system in a production scenario by disabling the Scripts it includes so that no load is generated when the Test is run.
During a Test-run you can monitor Task Group activity from the Monitoring tab of the Test Pane. The results collected can be displayed as they are returned to the Repository while a Test is running or after a Test-run is complete, to assist you in the analysis of the target WAE performance.
See also:
Core Functions of HTTP/S Load
HTTP/S Load supplies versatile software that caters for the needs of different users and the type of system you are evaluating, by supplying the full range of functions that e-business project managers and system performance testers need in order to develop transparent, easy to maintain Tests.
HTTP/S Load is a modular software system in which the creation of Scripts, Collectors and Tests are separate processes that can be conducted independently. It provides the functionality required to support the tasks you need to conduct, in order to achieve the objectives of your performance tests.
All Test development procedures are initiated from Commander. Use it to create Tests and to coordinate the development process.
Performance Testing Using HTTP/S Load
- Create Scripts (Script Modeler).
- Model Scripts if required (Script Modeler).
- Create data collection Collectors - optional (SNMP, NT Performance).
- Create Tests, by adding Task Groups containing the Scripts and Collectors required (Commander).
- Define Task Group settings (Commander), including:
- Schedule settings to control when Task Groups start and stop during a Test-run.
- Host computers used to run a Task Group: Script and Collector-based Task Groups.
- Number of Virtual Users used: Script-based Task Groups only.
- Task settings control the number of Script iterations and the delay between iterations during a Test-run: Script-based Task Groups only.
- Run a Test (Commander).
- Monitor a Test-run (Commander).
- Display Test results (Commander).
Note: It is not necessary to stick rigidly to this procedural sequence.
HTTP/S Load supplies flexible software that enables you to work in ways that best suit you and the type of Test you are creating.
See also:
Using HTTP/S Load
The main areas of procedure supported by HTTP/S Load are summarized below:
- Creating Scripts
- Modeling Scripts
- Creating Collectors
- Creating Tests
- Running and Monitoring Tests
- Displaying Results
See also:
Creating Scripts
Creating Scripts involves deciding how you expect clients to use the WAE under test, then recording browser sessions which incorporate this behavior to produce Scripts. Scripts encapsulate the browser requests issued during a Web session at the HTTP/S level and form the basis of your Tests.
Browser requests and WAE responses are recorded using the OpenSTA Gateway. It is launched automatically when you begin recording a Script using the Script Modeler Module. The Gateway records the HTTP/S requests issued by a browser during Web sessions using SCL scripting language, which enables you to model their content.
Creating Scripts is a separate procedure within the Test development process, and can be carried out independently of Test and Collector creation. For more information see Recording Scripts.
See also:
Modeling Scripts
Modeling Scripts involves identifying and editing SCL code that represents user input during a browser session, so that the Scripts can be used in Tests to function as one or more Virtual Users during a Test-run. Modeling Scripts enables you to develop Tests that more accurately simulate the Web activity you want to reproduce during a Test-run.
Modeling Scripts is not an essential procedure, particularly if the WAE under test comprises static content only. But it is a useful facility if you need to record the dynamic changes of a WAE during a session. For example, you may need to use a unique user name and password for each Virtual User, so that the Test more accurately simulates real end user activity. You can achieve this by creating a Script then modeling it to include variables that change the user name and password for each Virtual User, every time the Script is run as part of a Test. Using just one modeled Script it is possible to create all the Virtual Users you need, each with unique identities just like real end users.
Script Modeling is enhanced beyond the addition of variables to a Script. The Web pages issued in response to browser requests are recorded at the same time as a Script is created. In HTTP/S Load there is the capability to use objects from these Web pages to model the corresponding Script. This modeling technique is known as DOM Addressing. This technique can be used to verify the results of a Test by checking the validity of WAE responses during Test-run. For more information see Recording Scripts and Modeling Scripts.
See also:
Creating Collectors
Creating Collectors involves deciding which Host computers or other devices to collect performance data from and the type of data to collect during a Test-run. HTTP/S Load supports the creation of NT Performance for recording performance data from Hosts running Windows NT or Windows 2000, and SNMP Collectors for collecting SNMP data from Hosts and other devices running an SNMP agent or proxy SNMP agent.
Collector-based Task Groups can be monitored during a Test-run. The data collected can be displayed alongside other results to provide information about a Test-run.
Creating Collectors is a separate procedure within the Test development process and can be carried out independently of Test and Script creation. For more information see Creating and Editing Collectors.
See also:
Creating Tests
Creating Tests first involves creating the Scripts and Collectors you want to include in them. Then select the Scripts and Collectors you need from the Repository Window and add them one at a time to a Test. Scripts and Collectors are included in Tests by reference. This means that you can include them in multiple Tests in which different Task Group settings apply.
The Scripts and Collectors you add are known as Tasks which are structured in Script-based and Collector-based Task Groups. A load Test must contain at least one Script-based Task Group which can include one, or a sequence of Scripts. Collector-based Task Groups are optional.
Create and run Collector-only Tests for performance monitoring and data collection within production scenarios. Or alternatively, use a load Test that includes Collectors and disable the Script-Task Groups it includes, to turn off the load element they supply before running the Test within a production monitoring environment.
The Test scenario you want to simulate during a Test-run can be controlled by adjusting the Task Group settings. Assemble the Scripts and Collectors of your Test then select the Task Group settings you want to apply in order to generate the level of load required. For Script-based Task Groups these settings include the Host used, the number of Virtual Users and the number of Script iterations per Virtual User. For Collector-based Task Groups the Host used to run the Task Group can be defined.
Creating Tests is a separate procedure within the Test development process, and can be carried out independently of Script and Collector creation. For more information see Creating and Editing Tests.
See also:
Running and Monitoring Tests
Running a Test enables you to imitate real end user Web activity and accurately simulate the test conditions you want in order to generate the level of load required against target WAEs.
The Task Groups that comprise a Test can be run on remote Hosts during a Test-run. Distributing Task Groups across a network enables you to run Tests that generate realistic heavy loads simulating the activity of many users.
You can monitor the progress of a Test-run by selecting a Script-based Task Group and tracking the Scripts and the Virtual Users that are currently running from the Monitoring tab of the Test Pane.
You can add Collector-based Task Groups to a Test which can be monitored by selecting the data collection queries defined in the Collector and displaying them in graphs. For more information see Running Tests.
See also:
Displaying Results
Running a Test then displaying the results enables you to analyze and assess whether WAEs will be able to meet the processing demands that will be placed on them.
HTTP/S Load provides a variety of data collection and display options to assist you in the analysis of Test results. When a Test is run a wide range of data is generated automatically. It enables you to collect and graph both Virtual User response times and resource utilization information from all WAEs under test, along with performance data from the Hosts used to run the Test.
After a Test-run is complete the results can be displayed. Open the Test you want from the Repository Window and click on the Results tab in the Test Pane, then select the results you want to display. For more information see Results Display.
See also:
Creating and Editing Collectors
The Commander Interface
Commander combines an intuitive user interface with comprehensive functionality to give you control over the Test development process, enabling you to successfully create and run performance Tests.
Use the menu options or work from the Repository Window to initiate the creation of Collectors, Scripts and Tests. Right-click on the Repository Window folders and choose from the functions available.
Work within the Main Window of Commander to create Collectors and Tests. The Main Window houses the Repository Window and supplies the workspace for Test creation using the Test Pane, and Collector creation using the Collector Pane. Use Script Modeler to create the Scripts you need.
After you have created or edited a Test or Collector in the Main Window they are automatically saved when you switch to another procedure.
The Commander interface is divided up into three primary areas:
Commander Interface Features
The main features of the Commander interface are detailed below:
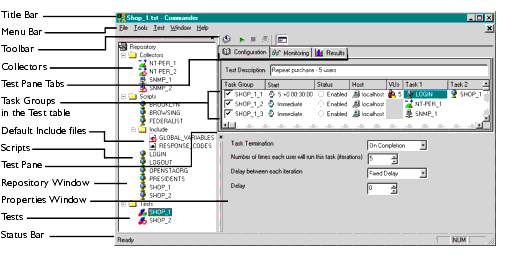
Note: The Test illustrated above contains Script-based and Collector-based Task Groups.
See also:
Commander Toolbars and Function Bars
Creating and Editing Collectors
Commander Toolbars and Function Bars
Function Bars
- Title Bar: Displays the Commander Control Icon
, which gives you access to the Control menu. It also incorporates the standard Windows buttons Minimize, Restore/Maximize and Close.
- Menu Bar: Displays Commander menu options, including the File option from where you can create new Scripts, Collectors and Tests.
- Some of the menu options available vary depending on the procedure you are performing. If you are editing a Test, the Test menu option appears. If you switch to editing a Collector, the Collector menu option appears, replacing the Test menu option.
- Select a menu option using your mouse or use the keyboard shortcuts to access the functions you need.
- Status Bar: Displays information relating to the current file.
Toolbars
When you start-up Commander no toolbars are visible. A toolbar relevant to the procedure you are conducting appears below the Menu Bar when you open a Test or Collector in the Main Window.
You can hide toolbars using the View menu option to maximize the workspace available in the Main Window. You can also float toolbars over the Main Window to increase the workspace area.
See also:
Hide/Display Toolbars
The Commander Main Window
The Commander Main Window is located below the Menu Bar and functions as a workspace and container for the creation of Tests and data collection Collectors.
The Test Pane is displayed here when you open a Test by double-clicking a Test icon,
or
, in the Repository Window. Use the Test Pane to create and edit Tests, then run a Test and monitor its progress. When results are returned they can be displayed here for analysis. For more information, see The Test Pane.
The Collector Pane is displayed in the Main Window when you open a Collector by double-clicking a Collector icon,
,
(NT Performance), and
,
(SNMP), in the Repository Window. Use this workspace to create and edit Collectors. For more information, see Creating and Editing Collectors.
The Repository Window is displayed in the Commander Main Window. Use it to initiate the creation of the Scripts, Collectors and Tests by right-clicking on the default folders within and selecting the menu options you need.
See also:
Commander Main Window Display Options
Commander Main Window Display Options
- Resize the Main Window to increase your workspace area by adjusting the borders of the Repository Window.
- Float the Repository Window over the Main Window to increase the workspace to the full width of the Main Window.
- Close the Repository Window to maximize the workspace area.
- Resize the Main Window by adjusting the borders.
The Repository Window
After you have planned your performance Test you can work from the Repository Window to initiate Test development procedures, including the creation of Scripts, Collectors and Tests. The Repository Window displays the contents of the Repository which stores all the files that define a Test. Use the Repository Window to manage the contents of the Repository by creating, displaying, editing and deleting Collectors, Scripts and Tests.
The Repository Window is located on the left-hand side of the Main Window by default and displays the contents of the Repository in three predefined folders
Collectors,
When you double-click on a Test or Collector in the Repository Window, they are opened in the Commander Main Window, where they can be developed or edited. Double-click on a Script in the Repository Window to open it using the Script Modeler. This Module is launched in a separate window where you can create and model Scripts.
The Scripts, Collectors and Tests stored in the Repository are organized alphabetically and can be deleted by using the right-click menu option associated with each file or by using the keyboard.
The order and appearance of the predefined folders, Collectors, Scripts and Tests, cannot be modified.
Repository Path
When you first run Commander the Repository that was automatically created in the default location within the program directory structure is displayed, which appears as
Repository. Additional Repositories can be created using Commander that can be located on your hard drive or on a networked computer.
We recommend changing the location of the Repository, especially if you expect to generate large volumes of Test related files, so that the performance of your computer is not compromised. Use the Select a New Repository Path option in the Tools menu to create a new Repository or change the path.
See also:
Repository Window Display Options
Collectors Folder
The Collectors folder in the Repository Window displays all the Collectors stored in the Repository and has a right-click menu option associated with it that enables you to create new Collectors.
Open the Collectors folder and display the Collectors contained by double-clicking
Collectors.
See also:
Collectors Folder and Collectors, Display Options and Functions
Creating and Editing Collectors
Collectors Folder and Collectors, Display Options and Functions
- Double-click
, or
, alongside the folder.
- Right-click
- Double-click on a new Collector
- Double-click on a Collector
- Note: When a Collector is open in the Test Pane, the Collector icon in the Repository Window appears with a small, yellow lock icon overlaid,
. This makes it easy to spot which Collector or Test is currently open in Commander. The name of the open Collector or Test is displayed in the Commander Title bar.
- Right-click on a Collector
- Note: If a Collector is open
- Note: Collectors are included in Tests by reference so editing their data collection queries affects the type of results recorded during a Test-run for all the Tests that use them.
Renaming a Collector or deleting one from the Repository means that the Tests using them cannot run. A missing Collector is still referenced in a Task Group and the altered status of the Collector Task is indicated within the Configuration tab of an open Test by highlighting in red the cell it occupies in the Test table. Tests can only run if a missing Collector is recreated, an existing Collector is renamed, or the Collector Task is deleted from the Task Group.See also:
Creating and Editing Collectors
Scripts Folder
The Scripts folder in the Repository Window displays all the Scripts stored in the Repository and has a right-click menu option associated with it that enables you to create new Scripts.
Open the Scripts folder and display your Scripts by double-clicking
See also:
Scripts Folder and Scripts, Display Options and Functions
Scripts Folder and Scripts, Display Options and Functions
- Double-click
, or
, alongside the folder.
- Right-click
- Double-click on a new Script
, to launch Script Modeler and record a web browser session.
- Double-click on a Script
, to launch Script Modeler and model the Script.
- Right-click on a Script
- Note: Scripts are included in Tests by reference, so modeling them affects the type of web browser activity generated during a Test-run for all the Tests that use them.
- Renaming a Script or deleting one from the Repository means that the Tests using them cannot run. A missing Script is still referenced in a Task Group and the altered status of the Script Task is indicated within the Configuration tab of an open Test by highlighting in red the cell it occupies in the Test table. Tests can only run if a missing Script is recreated, an existing Script is renamed, or the Script Task is deleted from the Task Group.
See also:
Tests Folder
The Tests folder in the Repository Window displays all the Tests stored in the Repository and has a right-click menu option associated with it that enables you to create new Tests.
Open the Tests folder and display your Tests by double-clicking
See also:
Tests Folder and Tests, Display Options and Functions
Tests Folder and Tests, Display Options and Functions
- Double-click
- Right-click
- Double-click on a new Test
- Double-click on a Test
, to open it in the Test Pane in the Commander Main Window, where you can add, delete and reorganize Task Groups containing Scripts and Collectors, then edit your Task Group settings.
- Right-click on a Test
See also:
Repository Window Display Options
The Repository window is located on the left-hand side of the Main Window by default. You can hide it to increase the Main Window workspace area available, move it to a new position or float it over the Main Window.
See also:
Hide/Display The Repository Window
Hide/Display The Repository Window
- Click
, in the double bar at the top of the Repository Window to close it.
- Select Tools > Show Repository to hide and display the Repository Window.
Move The Repository Window
- Click on the double bar at the top of the Repository Window.
- Drag, then drop it in the new position within the Main Window.
Resize The Repository Window
- Move your cursor over part of the window edge.
- Click and drag, then drop the border in the required position.
Select a New Repository Path
|
OpenSTA.org Mailing Lists Further enquiries Documentation feedback CYRANO.com |
 . This makes it easy to spot which Test or Collector is currently open in Commander. The name of the open Test or Collector is displayed in the Commander Title Bar.