![]()
Running Tests
Test-runs
Running a Test enables you to simulate real end user Web activity and to collect performance data from the components of the system under test. Use the results you produce during a Test-run to help evaluate the performance of target Web Application Environments (WAEs). You can also use HTTP/S Load to create and run Collector-only Tests to monitor WAEs in a production scenario. The ability to run load Tests and production monitoring Test means that you can directly compare the performance of your target system within these two environments.
HTTP/S Load's distributed software testing architecture enables you to run the Task Groups that comprise a Test on remote Hosts during a Test-run. Distributing Task Groups across a network enables you to run Tests that generate realistic heavy loads simulating the activity of many Virtual Users.
HTTP/S Load provides a variety of data collection and monitoring functions. When a Test is run a wide range of results data is collected automatically. This information includes Virtual User response times and resource utilization from all WAEs under test. You can also create and reference Collectors in your Tests to enhance the Test-run monitoring and data collection options available.
Create and add Collectors to your Tests to enhance the results data produced during a Test-run. Use SNMP and NT Performance Collectors to monitor, graph and record performance data from Host computers and other devices that form part of the system under Test, as well as the Test network.
You can monitor the progress of a Test-run and all of the Task Groups it contains from the Monitoring tab view of the Test Pane. Select NT Performance and SNMP Collector Task Groups to track the data collection queries they define. Select a Script-based Task Group to track the Scripts and the Virtual Users that are currently running.
Running a Test is a straightforward procedure, because the Task Group settings of the Collectors and Scripts you include in the Test have already been specified during Test creation. Open the Test you want to run and click the Start Test button
, in the toolbar.
At the end of the Test-run all results are stored in the Repository in date and time stamped folders. Display the data collected to help analyze the performance of the target system from the Test Pane of Commander.
See also:
Single Stepping HTTP/S Load Tests
Dynamic Tests
In HTTP/S Load Tests are dynamic, which means that the Test contents and settings can be modified while it is running, giving you control over a Test-run and the results that are generated.
New Task Groups can be added and the contents and settings of the existing Task Groups that comprise a Test can be individually edited by temporarily stopping the Task Group, making the changes required then restarting them. These facilities give you control over the load generated and enable you to modify the type of performance data you monitor and record without stopping the Test-run.
Note: It is not possible to remove a Task Group from a Test during a Test-run.
While a Test is running you can:
- Add a new Task Group.
- View the settings and status of Task Groups using the Properties Window and the Status column of the Configuration tab.
- Modify Task Group settings when the selected Task Group has stopped.
- These settings are:
- Schedule settings
- Host settings
- Virtual User settings
- Task settings
- Stop/Start a Task Group.
- Task Groups can be stopped and started during a Test-run using the Stop and Start buttons in the new Control column of the Configuration tab. The Stop button is displayed if the Task Group is Active and a Start button is displayed if the Test is running and the Task Group is stopped, otherwise no button is displayed.
See also:
Distributed Tests
HTTP/S Load supplies a distributed software testing architecture based on CORBA which enables you to utilize remote Host computers to run the Task Groups that comprise a Test. A Task Group can be run by a Task Group Executer process on a remote Host or the Repository Host during a Test-run.
Define the Host you want to run a Task Group when you add a Script or Collector to a Test. Open the Configuration tab of the Test Pane, then click on the Host column table cell in the selected Task Group and using the Properties Window to select a Host, for more information, see Select the Host Used to Run a Task Group.
OpenSTA Name Server
Before you can start a distributed Test the Hosts you have chosen to run the Task Groups must have the OpenSTA Name Server installed, running and correctly configured. Use the Name Server Configuration utility to configure the OpenSTA Name Server settings on all the Hosts running Windows in your Test network.
Before starting a Test-run, make sure that the OpenSTA Name Server is running on the Repository Host and that the Repository Host setting points to itself. You can configure this by right-clicking
, in the Task Bar and selecting the Configure option. Then specify the Repository Host setting by typing localhost, the computer name or the IP address of the Repository Host in the Repository Host text box. You will need to restart the OpenSTA Name Server to implement the configuration changes you make.
Then configure the remote Hosts you are using to run your Task Groups. The Repository Host setting must point to the Repository Host, which is the machine from where the Test will be run.
When a Host is running Commander, the OpenSTA Name Server and the Name Server Configuration utility should be running by default, because they are setup to launch automatically when you launch Windows. When they are both running, they are represented in the Task bar by the Name Server Configuration utility icon,
See also:
Launch the OpenSTA Name Server and the Name Server Configuration Utility
Change the Repository Host Setting of the OpenSTA Name Server
Launch the OpenSTA Name Server and the Name Server Configuration Utility
See also:
Change the Repository Host Setting of the OpenSTA Name Server
Change the Repository Host Setting of the OpenSTA Name Server
- In the Task Bar, right-click
- Select Configure from the menu, to display the OpenSTA Name Server dialog box.
- Remote Hosts must point to the Repository Host:
In the Repository Host text box enter the computer name or IP address of the Repository Host which will be used to run the Test.- Click OK.
- Note: You will need to restart the OpenSTA Name Server to implement the configuration changes you make.
- Always start the OpenSTA Name Server on the Repository Host before configuring and restarting the OpenSTA Name Server on remote Hosts. If the OpenSTA Name Server shuts down on the Repository Host, you must restart the OpenSTA Name Server on all remote Hosts.
See also:
Launch the OpenSTA Name Server and the Name Server Configuration Utility
Start the OpenSTA Name Server
When the OpenSTA Name Server has stopped, the Name Server Configuration utility icon appears in the Task Bar with a small crossed red circle over it,
.
See also:
Change the Repository Host Setting of the OpenSTA Name Server
Stop the OpenSTA Name Server
When the OpenSTA Name Server is running, the Name Server Configuration utility icon appears in the Task Bar with a small ticked green circle over it,
.
- In the Task Bar, right-click
- Select Stop Name Server from the menu.
- Click Yes in the dialog box that appears to confirm your choice.
- Click OK to close the confirmation dialog box.
See also:
Shutdown the OpenSTA Name Server
- In the Task Bar, right-click
- Select Start Name Server from the menu.
- Click Yes in the dialog box that appears to confirm your choice.
See also:
Launch the OpenSTA Name Server and the Name Server Configuration Utility
Test-run Procedure
If you have not already compiled your Test, clicking the Start Test button
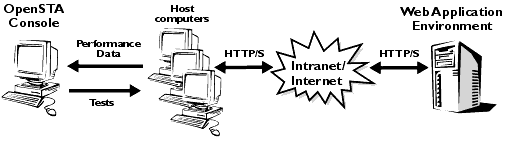
A Test is run from one or more Host computers across a network. Target WAEs are injected with HTTP/S and load is generated against them. Collectors included in a Test are also launched and begin collecting the performance data as instructed from the devices you have targeted. You can monitor the data collection recorded by Collectors during a Test-run and the activity of the Scripts and Virtual Users. WAE responses are recorded as performance data which can be displayed after the Test-run is complete.
HTTP/S Load Test
During an HTTP Test, target WAEs are injected with HTTP/S and load is generated against them using. The load you generate is only limited by the availability of system resources.
Use Commander to monitor the activity of the Scripts and Virtual Users included in your Test then display the HTTP data on completion.
The Test-run process within a Web Application Environment is illustrated below:
Note: OpenSTA Console refers to a computer which has an installation of OpenSTA. This includes the OpenSTA Architecture, Commander and the Repository.
Tests can only be run one at a time in order to achieve consistent and reliable results that can be reproduced. The Host computers used to run a Test should be dedicated to this purpose.
You can terminate a Test-run at any stage using the Stop Test button
, or the Kill Test-tun button
in the toolbar. Use
When you run a Test, a Test-run folder with the date and time stamp is automatically created in the Repository. Display the results collected during a Test-run by clicking on the Results tab of the Test Pane then using the Results Window to open up Test-run folders and selecting results options for display.
See also:
Run a Test
- In the Repository Window, double-click
Tests to open the folder and display the Tests contained.
- Double-click the Test
you want to run, to open it in the Test Pane.
- Check the Test contains the Scripts and Collectors you want and that the Task Group settings are correct, then click
- Note: When you run a Test the Scripts it contains are automatically compiled. If there are errors during compilation the Compile Errors dialog box appears displaying the location and name of the Script that failed and details of the SCL error.
You can export these error messages to a text editor for easier viewing by right-clicking within the Details section of the Compile Errors dialog box, then selecting, copying and pasting the text. You can also make use of the single stepping functionality available to help identify errors that may occur during a Test-run.- After your Test has been compiled successfully the Starting Test dialog box appears, which displays a brief status report on the Test-run.
- When the Test is running the entry in the Test Status box at the top of the Monitoring Window reads ACTIVE.
- Tip: Click on the
Monitoring tab within the Test Pane during a Test-run and select the Task Groups required, to monitor the performance of target WAEs and Hosts in graph and table format.
- On completion of the Test-run, click the
Results tab within the Test Pane, to display the results generated.
See also:
Single Stepping HTTP/S Load Tests
Monitoring a Test-run
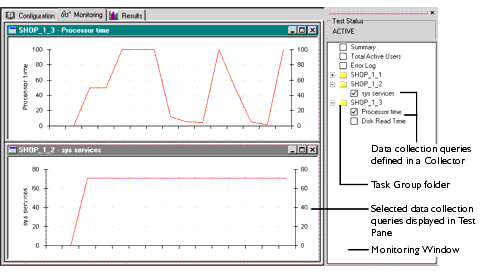
During a Test-run all Task Groups, the Tasks they contain and summary information can be monitored using Commander, from the Monitoring tab of the Test Pane. Open the Test that is currently running from the Repository Window, then click the
Monitoring tab in the Test Pane. Use the Monitoring Window, which is displayed by default on the right-hand side of the Main Window, to pick the options you want to display in the workspace of the Test Pane.
The display options listed in the Monitoring Window include all the Task Groups defined in the Test, plus a Summary display option which you can select to display an overview of Test-run activity that includes the Task Group name, type and the length of time it has been running. The display options available depend on the type of Test you are running. If your Test includes Scripts the Total Active Users graph is populated with HTTP-related data. The type of Collectors you include in a Test and the data collection queries they define also affects the display options available. Adding Collectors to a Test enhances your monitoring options by enabling you to select and monitor the data collection queries they define. Open up a Task Group folder that contains the Collector you want to monitor, then select the queries you want to display using the Monitoring Window.
When you run a Test the following display options are available for monitoring:
- Summary: Provides a summary of Test-run and Task Group activity including Task Group name, status and duration, HTTP data, Virtual User and Task-related details.
- Total Active Users: Displays a graph indicating the number of active Virtual Users.
- Error Log: Enables you to monitor errors as they occur giving details of the Time, Test Name, Location and Message for each error.
- Collector-based Task Groups: Performance Anomalies and data collection queries.
- Script-based Task Groups: Task details and the number of Virtual Users running.
After you have selected your monitoring display options, you can hide the Monitoring Window to increase the workspace area available for displaying your data.
Click, in the toolbar to hide and display the Monitoring Window.
Use the Task Monitor Interval function to control the frequency at which performance data is collected and returned to Commander for display. Data collection takes up processing resources and can affect the performance of the Test network so it is best to set the Task Monitor Interval to a high value. This function relates to HTTP data and does not affect the data collection interval or polling time you set in Collectors.
If you encounter errors during a Test-run make use of the single stepping functionality provided to check your Tests and to help resolve them. You can monitor the replay of Script-based Task Groups included in a Test and check the HTTP data returned. For more information see Single Stepping HTTP/S Load Tests.
See also:
Monitor Scripts and Virtual Users
Monitor NT Performance and SNMP Collectors
Select a Test to Monitor
Use this function to open up the Test that is running by switching from whatever function you are currently performing in HTTP/S Load to the Configuration tab of the Test Pane.
- Click Tools > Monitor.
- In the Select Test To Monitor dialog box, click the Test name displayed in the selection box.
- Click the Monitor button.
Set the Task Monitoring Interval
Use this function to control the frequency at which HTTP, Error Log and Summary data is collected and returned to Commander for monitoring.
- Open the Test that is running and click the
- Click the Task Monitor Interval button
, in the toolbar.
- Enter a value in seconds in the text box.
- Click OK to apply your setting to control the data refresh rate.
Monitor a Summary of Test-run Activity
- Open the Test that is running and click the
- In the Monitoring Window click the Summary option.
- A summary of Test-run data is displayed in the Monitoring tab. The Summary Window is divided into 2 panes, the Test Summary pane and the Task Group Summary pane:
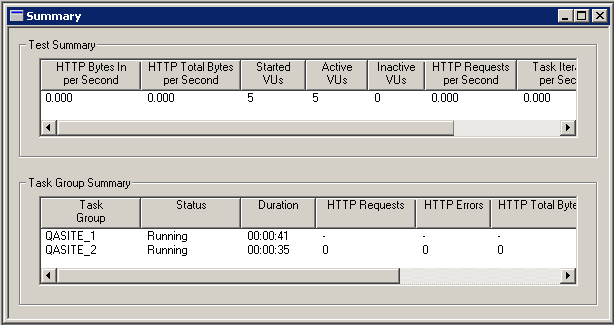
- The Test Summary pane displays test-specific statistics regarding overall test activity.
Data categories provide a range of statistics relating to virtual users, HTTP requests and errors, and connection times.- The HTTP Bytes In per Second and HTTP Bytes Out per Second columns give details of the number of bytes issued and received for HTTP requests per second. The HTTP Total Bytes per Second column measures the total number of bytes for HTTP issue and receipt per second.
- The HTTP Errors per Second column indicates the number of 4XX and 5XX error codes returned from the Web browser after the HTTP request has been sent per second. These error codes adhere to the World Wide Web Consortium (W3C) standards. For more information visit: http://w3.org/Protocols/HTTP/HTRESP.
- Other data categories include:
Minimum Request Latency, Maximum Request Latency and Average Request Latency. These categories give details of the minimum, maximum and average time elapsed between sending an HTTP request and receiving the results.- Tip: Right-click in the Test Summary pane of the Summary Window to control the column display by selecting or deselecting the column names from the pop-up menu.
- The Task Group Summary pane presents Task-specific statistics relating to individual Task activity. There is a row entry for each Task Group, facilitating Task monitoring.
- Data categories include those described in detail above. Also available are Task Group name, status, duration and Task period.
- The following data categories included are also measured per second:
- HTTP Requests, HTTP Errors, HTTP Bytes In, HTTP Bytes Out, HTTP Total Bytes.
- Tip: Right-click in the Task Group Summary pane of the Summary Window to control the column display by selecting or deselecting the column names from the pop-up menu.
- Note: Click
, in the Title Bar of a graph or table to close it or deselect the display option in the Monitoring Window.
Monitor Scripts and Virtual Users
- Open the Test that is running and click the
- In the Monitoring Window click
, next to a Script-based Task Group folder to open it. The Script-based Task Group folder lists the Script Tasks it contains.
- Select a Script from the Monitoring Window to track Virtual User activity.
- Data for all the Virtual Users running the selected Script-Task are displayed in the Test Pane. The data categories are Virtual User ID, Duration, Current Script-Task iteration and Note Text connected with each Virtual User. Note text is included for the last NOTE command executed by a Virtual User.
- Note: When a Test-run is complete, the entry in the Test Status box at the top of the Monitoring Window reads INACTIVE and the display options in the Monitoring Window are cleared.
See also:
Set the Task Monitoring Interval
Monitor NT Performance and SNMP Collectors
- Open the Test that is running and click the
- In the Monitoring Window click
- Select one or more of the data collection queries you want to monitor from the Monitoring Window.
Stop/Start a Task Group
- Open the Test that is running with the
Configuration tab of the Test Pane displayed.
- In the Status column of the Test table, click the Stop button that appears when a Task Group is running to terminate the selected Task Group.
Terminate a Test-run
Note: The Test you want to terminate must be open in the Commander Main Window.
- Open the Test that is running in the Test Pane.
- Click the Stop Test button
- Note: Use
- Or,
- Click the Kill Test button
- Note: Use
See also:
Trace Settings
The Trace Settings function is used to record the activity of the Test Executer processes that execute the Test and its constituent Script and Collector Task Groups when a Test is run. If you encounter problems during a Test-run, use the Trace settings option to supply you with information on the Test Executer processes and help identify the problem.
The level of data logged using this option can be increased from None, which is the default setting to High, until information relating to the problem is recorded. The amount of Tracing you select will have an affect on the performance of your system so it is best to increase tracing levels gradually over a series of Test-runs until you are able to identify the cause of a problem using the Trace files that are generated.
If you have additional OpenSTA Modules installed extra process entries are added to the Target Name entries column in the Trace settings dialog box, which is used to set the Trace level you want.
After a Test-run is complete the Trace files generated for the Test Executers you have selected are copied to the Repository where they can be found in the Test-run folders.
See also:
Specify Trace Settings
|
OpenSTA.org Mailing Lists Further enquiries Documentation feedback CYRANO.com |
 in the Task Bar.