This section gives a brief introduction to the data display features of OpenSTA, and shows how to access the various results.
You should work through it with the results you collected from the last test run. This should give you an idea of the possibilities available if you had data from a test run with hundreds of simulated users, where the Web system under test was actually being loaded to an extent that response times were affected.
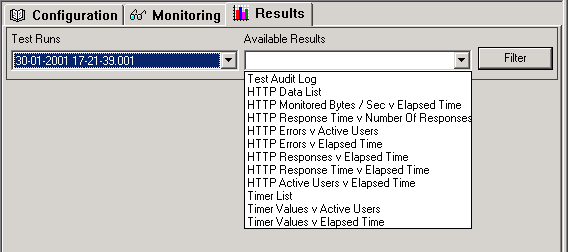
When you select a Test Run, the list of Available Results is displayed, as shown below:
The HTTP Data List is presented in a table format. This can be sorted by clicking on the column headings in the normal Windows manner. The results can be filtered by a variety of mechanisms. They can also be exported to a CSV file, to allow import into many other data analysis and report-generating tools.
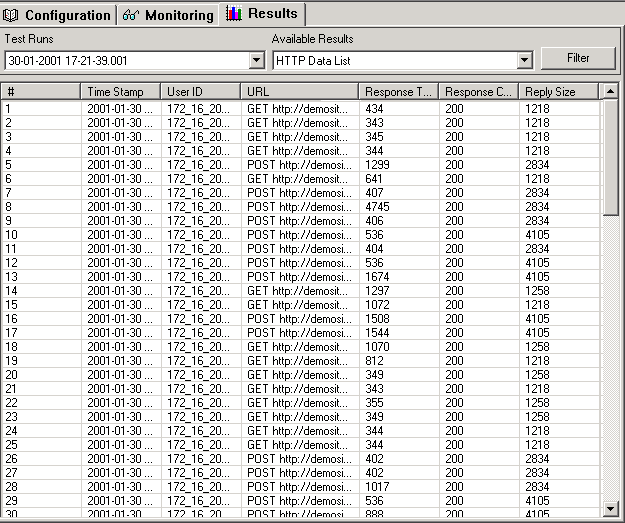
These statistics are very raw and may be incomplete, depending on the amount of server statistics that the test is set up to collect.
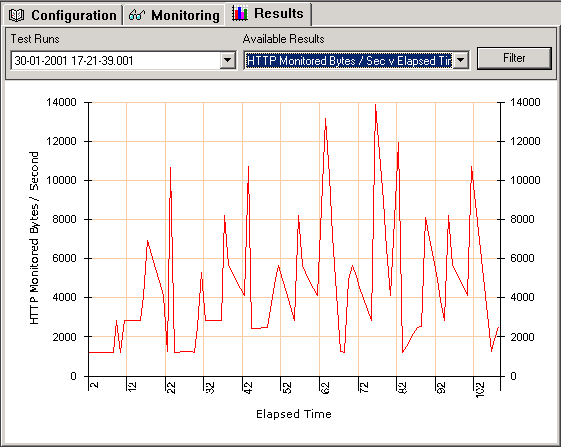
Below is a screenshot of one of the graphs which can be displayed. By right-clicking on the graph, you can choose to Customize the look of the graph, e.g. display the graph as a set of vertical bars.
From the example tests you should have run while working through this guide, you will probably not have generated any meaningful or particularly interesting data, but we hope this page has shown you the potential for analyzing your own Web applications.