A Performance Profile is a collection of user defined queries, NT Performance or SNMP, which specify the data to be collected during a test run.
To create a new NT Performance Profile, use the menu item:
Type in the name of your Profile, this example uses "WEBSERVER", and press return.
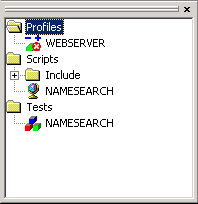
The Repository View should now look like this screenshot:
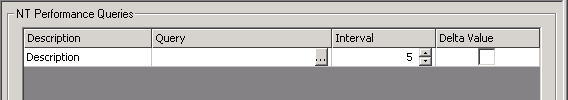
To define the profile, double-click on the icon in the Repository View. The profile definition grid appears, with a single empty row.
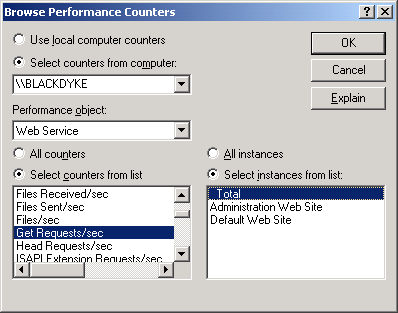
A query can be created by click on the ellipsis button in the Query column. This brings up the standard Browse Performance Counters dialog. In the example, below, we have selected the Get Requests/sec counter from the Web Service object.
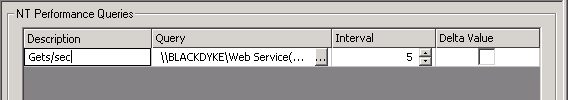
After selecting a counter, and clicking on OK, you should give the counter a description.
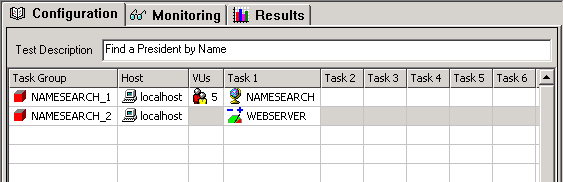
Profiles are added to Tests in a similar way to Scripts. You simply drag and drop them onto a new row in the Test definition grid. However, you can only have one profile per Task Group and a profile does not have any Virtual Users associated with it. The screenshot below shows the "NAMESEARCH" Test with the newly created "WEBSERVER" profile added.
Profiles defined as part of the Test can be monitored and produce additional Test Results.
A detailed discussion of Profiles and their use is beyond the scope of this guide.