Your first step towards testing with OpenSTA is to create a script. The recording process will capture all the HTTP traffic involved in your use of the Web site. This will include the user ID and password given to access the site, and the cookies that the Web browser and server exchange in order to maintain state.
To create a new script, use the menu item:
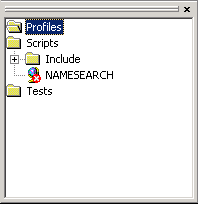
Type in the name of your script, this example uses "NAMESEARCH", and press return.
The Repository View should now look like this screenshot:
Recording a script is done using the Script Modeler. The Script Modeler can be started by simply double-clicking on the icon of your new script in the Repository View pane of Commander. When started with a new script, the Script Modeler is ready to record, and should look something like the screenshot below:
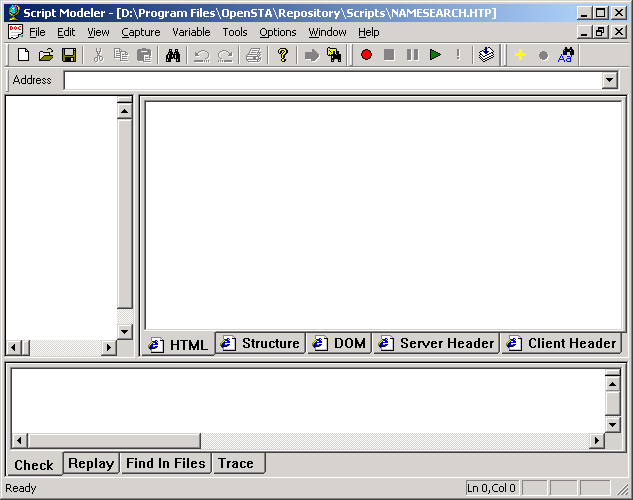
The Script Modeler application window uses a three-pane design. The functions of these panes are as follows:
Before you make a recording, we suggest you make sure you are familiar with the Web site you are going to test. You should make sure that it is functioning correctly if you have installed it locally, and also that you understand the basic behavior of the site. The summary below should help you with this.
Which US President?This is a simple Web application that provides a variety of information concerning past presidents of the United States. The presidents are selected through a filtering search. The application has five sections of interest:
The Login page requires a user ID and password. To keep the CGI simple yet have a realistic login, there is no pre-defined user database: passwords are authenticated by being the reverse of the user ID. For example, the password for the user ID "guest" is "tseug". The login session is maintained by the use of a site cookie. The application also implements a very simple session time-out mechanism. This is done by encoding the last session access time into the site cookie, which is updated on each access. |
The next step is to set up your Web site recording environment. Firstly you need to define the browser you want to use during the recording. The recording mechanism makes use of a pseudo proxy; this involves adjusting the proxy settings of the browser being used to make the recording, for the duration of the recording.
To choose the browser you want to record, select:
From the dialog that this invokes, use the drop-down menu to select the browser you want to use in the recording, and click OK. Now when you start recording, that browser should be invoked.
To start the recording, click on the Record button (with the red circle) on the toolbar.

This should cause the selected browser to open, ready to begin recording. The browser will have had its proxy settings adjusted to use the pseudo proxy. You can check these adjusted proxy settings using your browser's Proxy Properties dialog.
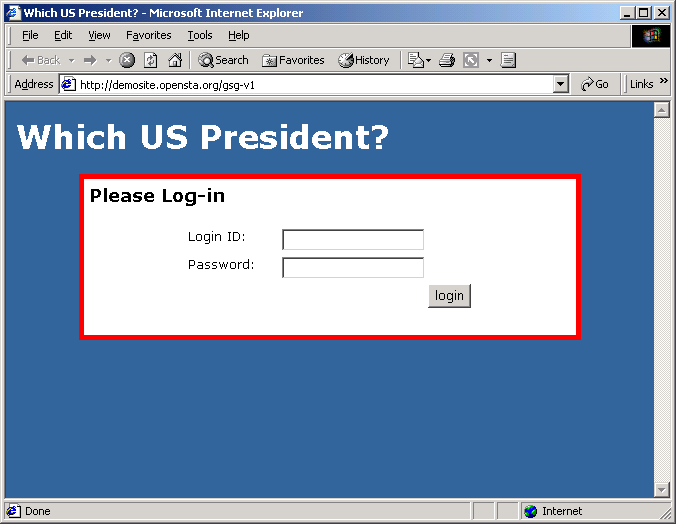
To make the recording, simply use the browser as you normally would, and go through the Web application steps you want to record. For the example here, the first step is to go to the login page, which you should do by typing in the URL of your locally installed copy or that of the online copy. The online copy of the demo Web application can be found at:
To keep our example very simple, log in using the same single letter for both Login ID and password: any single character will always authenticate because the 'reverse rule' is always true. This guide uses X for the Login ID and Password. When you have entered these values, your browser should look something like this:
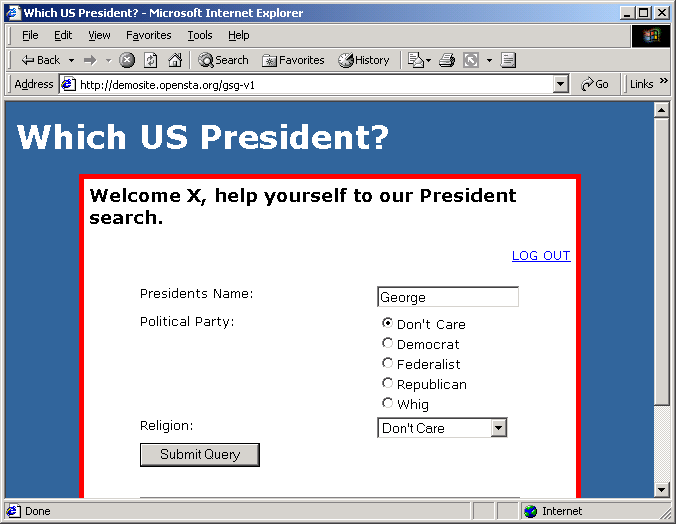
Now click the Login button; this should take you to the application's Search form. For this example, we want to carry out a very simple search using only the President's Name field. Search for George by typing this in the field, then clicking the Submit Query button. The form should look something like the following screenshot:
The results that are returned should be similar to the screenshot below.
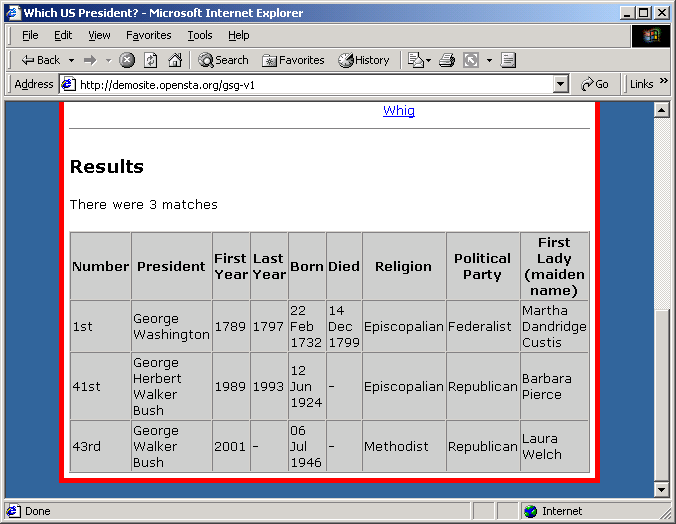
Once you have viewed these, use the LOG OUT link in the top right corner of the page. This should return the application to the Login page.
When these steps are completed, you have finished all the application actions that need to be recorded for this example. You should end the recording by exiting from the browser. Returning to the Script Modeler after the recording completion should find it looking something like the screenshot below:
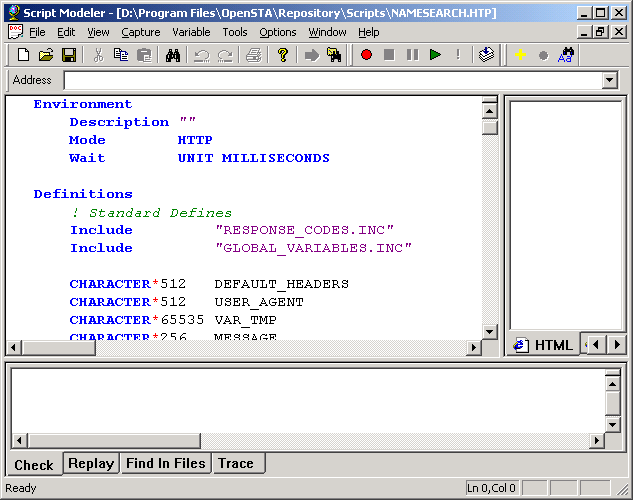
The SCL script created from the recorded browser session is seen in the top left pane of the Script Modeler. If you scroll down through the Environment, Definitions and Code sections of the script, you should get a general idea of the format of the SCL language and how it has been used to record the HTTP activity between your browser and the Web application to be tested.
Further information about the HTTP GET and POST requests in the script is shown in the tabbed display of the top right pane. To access this information, select an HTTP request by placing the text cursor in the SCL pane, anywhere within the SCL command representation of the GET or POST request you want to select; then click on the URL Details button (yellow arrow) on the toolbar.

When an HTTP request is selected, the SCL command that represents it has a yellow triangle in the margin next to it on the SCL pane, and the right tabbed pane shows the further details of this request. The screen below shows the HTML tab selected in the right pane; this shows the browser view of the results produced by the Search POST selected in the left pane.
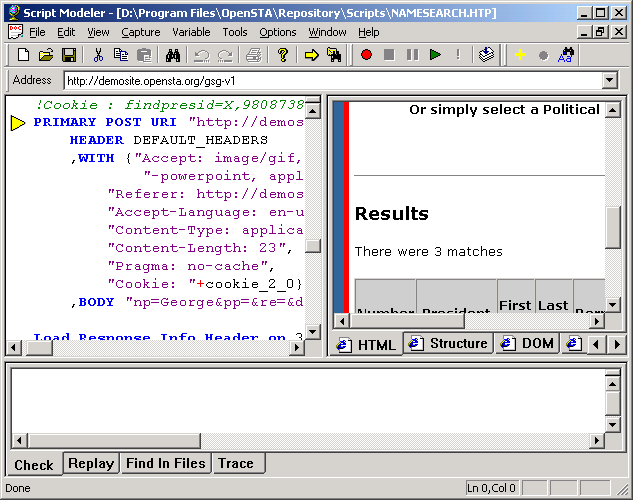
When an HTTP request command is selected, the other tabs in the right pane can be examined to find out more information about the HTTP request and the results that it generated. These tabs allow you to track exactly what happened in your recording. In more advanced use than covered here the tabs also allow mapping of page components to SCL variables
SCL is a compiled language with a relatively strict syntax. To check the validity of the SCL code in the script created by the recording, and produce the object file that is needed to perform a replay using the script, click the Syntax Check button (showing a stack of paper and a down arrow).

If your SCL is well formatted and passes this syntax check, then it will have been successfully compiled. This is shown in the bottom, full-width pane of the Script Modeler. If the script compiles successfully, this pane should look something like this:
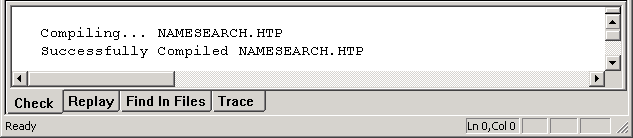
As you have not made any changes to the script yet, you should have no problems with this step. If there were problems in the SCL code syntax, these would be reported in this bottom pane and the message would indicate an error.
If the script is free of errors, it can now be replayed. The Script Modeler has the capability to replay a single-user session using the loaded script; to replay a session, click the green Replay triangle on the toolbar. The results of this replay are logged to the Replay tab of the bottom pane of the Script Modeler. This feature can be very useful for debugging a script, but for full replay in a multi-user load or stress testing scenario with statistics being gathered, you must return to the Commander and run this script as part of a test. The next section will cover this.
When closing down the Script Modeler, make sure that changes to your script have been saved, either via the menu option or toolbar, or from the warning dialog that is displayed if you exit without saving a modified script.