This section is intended to expand on the brief introduction to the data analysis features that was given in the previous section. This section describes how to access the various statistics.
You should work through it with the results you collected from the last test run. This should give you an idea of the possibilities available if you had data from a test run with hundreds of simulated users, where the Web system under test was actually being loaded to an extent that response times were affected.
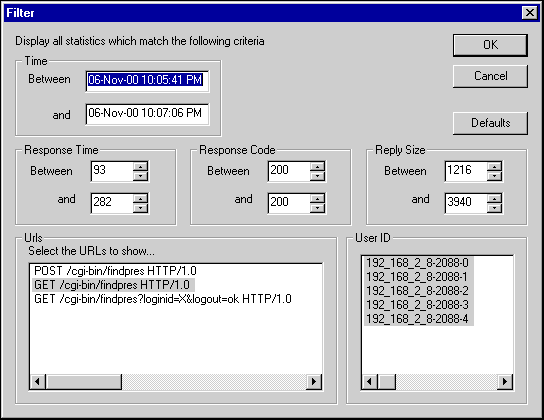
The HTTP Statistics gathered are presented in a table format. This can be sorted by clicking on the column headings in the normal Windows manner. The results can be filtered by a variety of mechanisms, as shown by the screenshot below. They can also be exported to a CSV file, to allow import into many other data analysis and report-generating tools.
These statistics are very raw and may be incomplete, depending on the amount of server statistics that the test is set up to collect. The next section of statistics, accessed from the Statistics menu item of the results, has a broader and much more controlled view of the available data. Once the menu item has been selected, the Selection Criteria dialog appears:
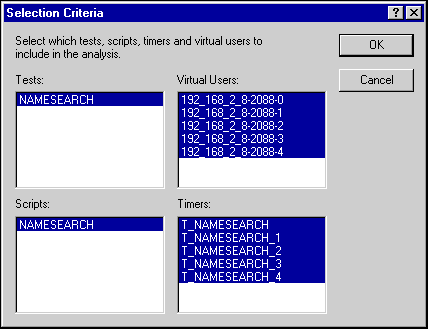
This dialog allows you to filter the Timer data generated by the test run. The timers are automatically created in your script. There is a timer for the whole of the recorded session, and one for each of the pages visited in the session. The overall timer's name is the same as the script name, prefixed with T_. The page timers have the same name, followed by an underscore and the sequence number of the page.
As you get more used to the scripting language, you may find it a useful exercise to change these generated names to more meaningful ones, and/or to introduce further timers.
You would not normally want to select all the named timers: the unnumbered timer will be roughly the total of the others, and the page timers may have widely differing values because of the contents. Merging the values for all these timers may or may not make sense, depending on your test.' Once the timer data has been selected, click OK to display the Graphs and Test Runs dialog. In the upper part of this dialog, you select the graphs to display; in the lower part, you select the test run that is to be analyzed.
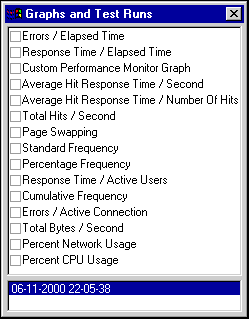
When the Graphs and Test Runs dialog is displayed, and the Analyzer toolbar is enabled. From this toolbar, you can do the following:
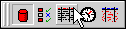
Below is a screenshot of the the Analyzer toolbar with the cursor pointing at the Timer List:
Here is a tiled view of the TestCommander workspace, showing a selection of the graphed data:
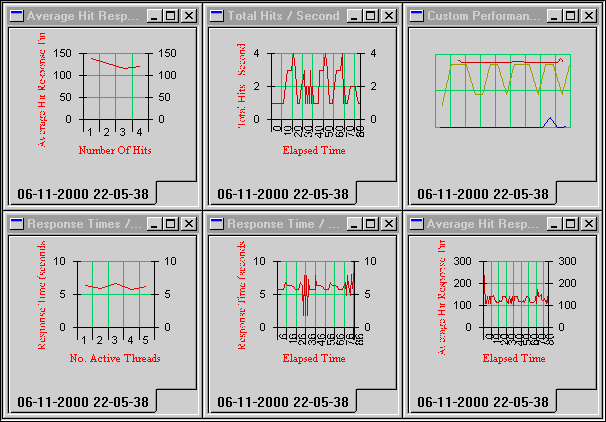
From the example tests you should have run while working through this guide, you will probably not have generated any meaningful or particularly interesting data, but we hope this page has shown you the potential for analyzing your own Web applications.