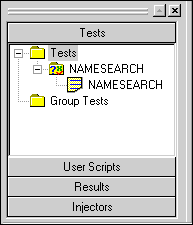
The Tests section of the Tree View in TestCommander should now no longer show the crossed red circle over your script icon (you may need to force a screen refresh, by collapsing and expanding its folder, to see this). The Tree View should look like the following screenshot:
At this stage your Test should be ready to run. To finalize its settings and begin its execution, you can click on the Execute icon (traffic light) in the Run toolbar.

This should start the Execute dialog, which is where you would allocate virtual users to Injectors if this was a complex distributed test. As this first run will be very simple and only contain a single user and script, all you need to do is allocate the user to the script. This is done by clicking the up-arrow beneath the script name (at the right side of the dialog). This increments the Users field to 1, which in turn decrements the number of users to dispatch to 0, as shown below:
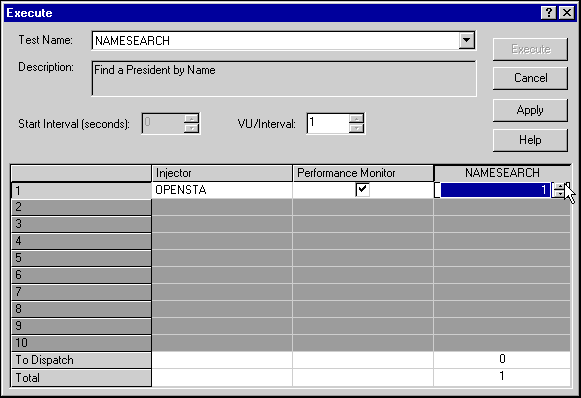
With all the virtual users allocated, you can click Apply, which will compile the complete test into its final form. Doing this should log status messages in the bottom pane of TestCommander, to verify that the operation has succeeded. Once this has successfully completed, the Execute button will be activated and ready for you to click on and run your test. You should click this button now.
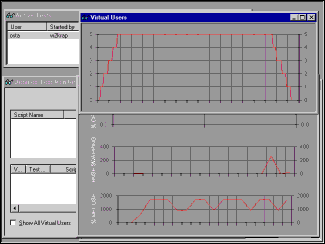
While a test is running, you will see the Active Tests window in the TestCommander workspace area. This should look something like the screenshot below.
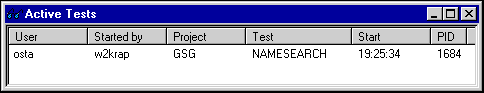
The test should not take long to finish (the same length of time it took you to record it); when it does finish, the Active Tests window will be empty. You can view the results of the test that you have just run by selecting the Results tag of the Tree View pane, as shown in this screenshot.
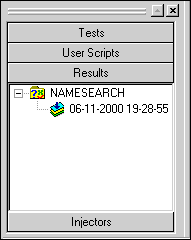
The results will be stored in a folder with the name of the test that created them, and labeled with the time and date of the test run.
Double-clicking the icon for the results you just created will bring up the Result Viewer window in the TestCommander workspace. This should initially be showing the Audit of the test run; details in the Audit log usually record the mechanisms of running the test. This window can also display Report and History logs. However, there will be nothing in these for the test you just ran, because specific SCL commands need to be inserted into your script to cause data to be written to them.
Right-clicking on your time-stamped Result icon will give you access to two further types of result: the Statistics and the HTTP Statistics. The HTTP Statistics give details of the HTTP requests made by your script, including the response times and codes for every request. These are the statistics that are affected by the server statistics drop-down menu on the Test Definition dialog. This setting affects the number of virtual users that the statistics are saved for. The more general Statistics selection from the menu allows you to analyze the timers that are defined in your script, along with all the other data collected as part of a test.
The next section covers statistics in more detail. Feel free to experiment with viewing the statistics you have just generated, but they will be of little interest because they are of a single user doing exactly as you did in the recording. For some meaningful data analysis you of course need more data; the next step shows you how to simulate more users in order to generate this data.
To increase the amount of data created by your test, you need to edit the test. Right-click on the icon of your test in the Tests section of the Tree View pane, and select Edit from the menu.
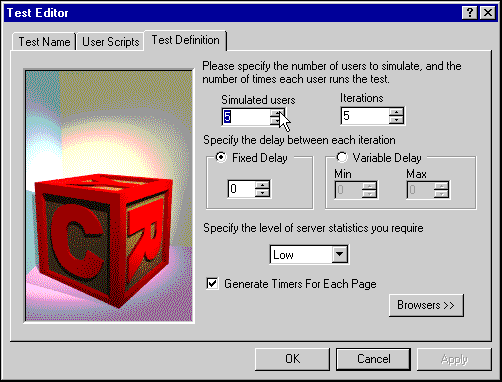
The dialog box that appears has tabs to represent the data sections you initialized the test with when you created it. You need to edit the Test Definition tab to increase the parameters of the test, so that more data is created. If you increase both the Simulated Users and the Iterations to 5, you will simulate five virtual Web users each running your script from beginning to end five times. This means you will have 25 times more data than your initial run. The Test Definition tab should look like the screenshot below:
If you click OK to close this dialog with the updated values, you should be able to execute your test as you did before.
Before actually starting the test running, you will need to allocate your four new simulated users to your defined Injector. In a real test, you might want to run it in a distributed fashion, by dividing the users in your test between several Injectors.
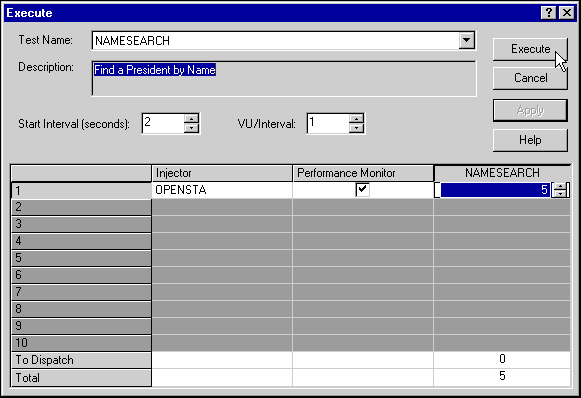
In this test, we will not start all the users at once, but introduce them at intervals instead. This technique allows you to create a ramp-up period in a load test, or to track bottlenecks from your generated statistics in a stress test. This example uses a Start Interval of 2 seconds. Because the VU/Interval is set to 1, a single simulated user will be introduced to the test every 2 seconds.
When you have set these values and clicked Apply, your Execute dialog should look something like the screenshot below:
You can now click Execute and run the test. This time the test should take longer to complete, so you can take the chance to look at some of the features available for monitoring your test in real time.
If you right-click on the row of information for your test in the Active Tests window, you will be presented with a menu that allows further information to be displayed:
The menu also allows the Active Tests window to be filtered, and individual tests to be killed before they finish naturally.
With this larger test completed, your next task is to look into the facilities for analyzing the data produced. This is covered in the next section.