![]()
Displaying Test Results
After a Test-run is complete use Commander to control which results are displayed and how they are presented, in order to help you analyze the performance of target WAEs and the network used to run the Test.
Open the Test you want from the Repository Window and click on the
Results tab in the Test Pane, then choose the results you want to display using the Results Window. Depending on the category of results you select, data is displayed in graph or table format. You can choose from a wide range of tables and customizable graphs to display your results which can be filtered and exported for further analysis and print.
Use the Results Window to view multiple graphs and tables simultaneously to compare results from different Test-runs.
When a Test is run a range of results data is collected automatically, including performance data from the Hosts used to run the Test. Results categories include the Test Summary option which presents a brief description of the Test and the Task Groups settings that applied during a Test-run and the Test Audit log records significant events that occur during a Test-run.
Creating and referencing Collectors in a Test helps to improve the quality and extend the range of the results data produced during a Test-run. NT Performance and SNMP Collectors give you the ability to target the Host computers and devices used to run a Test and the components of WAEs under test, with user-defined data collection queries.
Results Tab
Results are stored in the Repository after a Test-run is complete. You can view them by working from the Repository Window to open the Test you want, then click on the
Use the Results Window to select the results you want to view in the workspace of the Test Pane. You can reposition the Results Window by floating it over the Main Window to give yourself more room for results display, or close it once you have selected the results options you want to view.
The Results Tab of the Test Pane
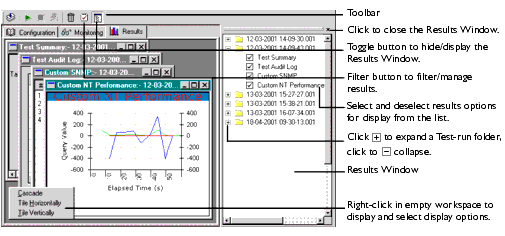
The Results Window
When you click on the Results tab, the Results Window opens automatically. Its default location is on the right-hand side of the Test Pane where it is docked. Use it to select and display results from any of the Test-runs associated with the current Test.
Test-runs are stored in date and time stamped folders which you can double-click on to open, or click
. When you open a Test-run folder, the available results are listed below. Display the results you want by clicking on the options and ticking the check boxes to the left of the results options. The results you choose are displayed in the Test Pane.
Multiple graphs and tables from different Test-runs associated with the current Test can be displayed concurrently. Use the Results Window to select additional Test-runs and equivalent results options to compare Test results and help evaluate performance.
Display Test Results
- In the Repository Window, double-click
Tests to expand the directory structure.
- Double-click the Test
, whose results you want to display.
- In the Test Pane click the
- In the Results Window, double-click on a Test-run folder or click
- Click on a results option to display your selection in the Test Pane.
- A ticked check box to the left of a results option indicates that it is open in the Test Pane.
- Note: Click
, in the title bar of a graph or table to close it or deselect the results option in the Results Window by clicking on the option.
- Tip: All available results have display and output options associated with them, These may include filtering, customizing and exporting. Right-click within a graph or table to display and select from the choices available.
- Use the Windows option in the Menu Bar to control the display of graphs and tables. Alternatively, right-click within the empty workspace of the Test Pane to access these functions.
Conclusion
The Test you have created and run whilst working through this guide will hopefully have given you an understanding of the basic techniques involved in successfully developing Tests to monitor and evaluate production environments using OpenSTA, in order to improve their performance.
|
OpenSTA.org Mailing Lists Further enquiries Documentation feedback CYRANO.com |